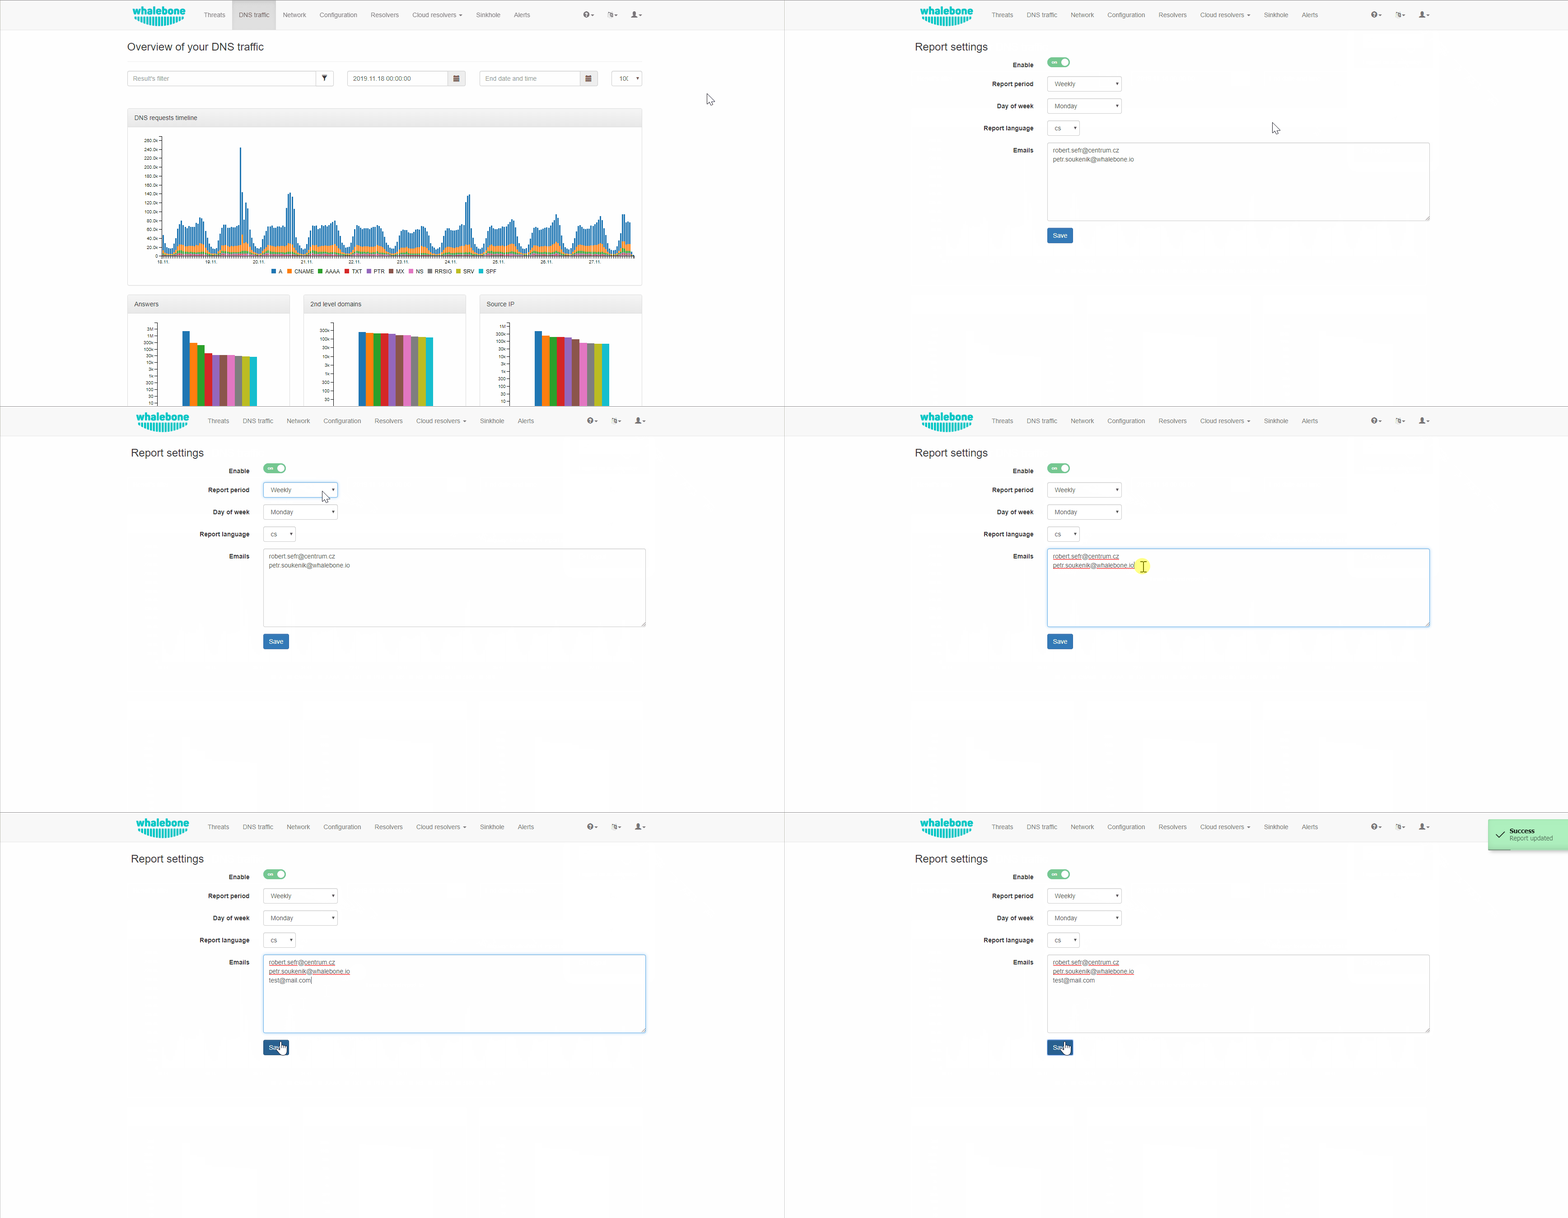
Reports
Reporting capabilities can be configured from the drop-down menu under a user’s account. The properties that can be customized, include the frequency that the reports are being delivered, the preferred day of the week, the language and the recipients.
Note
The default recipient is the owner of the account and the reports are delivered to their respective registered email address.

Alerts
Whalebone alerting provides live updates about key information such as resolver’s health, resolution status, hardware usage and it also informs about crucial security incidents and many more. All of these information can be passed through multiple channels e.g. email, slack, syslog or webhook. You can create new alert from predefined templates and alerts can be then customized by editing their parameters. You can watch step-by-step video guide here
Note
In order to turn on an alert, you first need to assign a destination for it. Click the alert name to expand it in detail and select the destination from the box. Multiple destinations may be selected by shift-clicking the addresses.
Note
When the alerting channel is syslog, by default TCP or TLS is supported as the transport layer protocol.
Note
The Syslog or Webhook alerts are sent from the following IP addresses: 159.100.247.142 and 159.100.247.58. If you select one of these channels, make sure to make an incoming TCP traffic exception on your firewall to be able to receive the message.
DNS traffic - count of unique requests from IP
This alert is triggered when a single source IP reaches the limit of unique requests with defined attributes. Parameters:
MINUTES: time window in minutes (Default=15)
TRESHOLD: number of events in timeframe to trigger alert (Default=100)
QUERY_TYPE: Filter by DNS query type (Default=*)
RESPONSE_TYPE: Filter by DNS response (Default=*)
IP_WILDCARD: Include only these these comma-separated IP addresses in the alert (Default=*)
IP_WILDCARD_IGNORE: Ignore these comma separated domains in the alert (Default=none)
DOMAIN_WILDCARD: Include only these comma separated domains in the alert(Default=*)
DOMAIN_WILDCARD_IGNORE: Ignore these comma separated domains in the alert (Default=none)
DGA: Filter by domain generation algorithm - Only DGA, Without DGA or both (Default=*)
DNS traffic - increased percentage of queries
This Alert will be sent when number of DNS traffic logs is percentually greater over configured time period. Parameters:
MINUTES: Timeframe - time window (Default=15)
PERCENT: Percentage increase (e.g. 200%) - difference between two intervals (Default=50)
QUERY_TYPE: Filter by DNS query type (Default=*)
RESPONSE_TYPE: Filter by DNS response (Default=*)
DNS traffic - possible homograph attack
This Alert is sent when a possible homograph attack for a specified domain is detected Parameters:
DOMAIN: Domain to monitor for possible homograph attacks (One alert can monitor only one domain)
DISTANCE: Number of characters that can differ in the phishing domain (Default=1)
DOMAIN_WILDCARD_IGNORE: Ignore this list of comma separated domains in the alert. In case DISTANCE is larger than 1, there will be a detection on domains that support both a global and regional top level formats. It is recommended to add the legitimate domains in the whitelists in order to avoid unnecessary alarms. (Default=none)
DNS traffic - treshold for unique queries
This Alert is sent when threshold for filtered unique DNS logs is reached Parameters:
MINUTES: Timeframe - time window (Default=15)
TRESHOLD: Threshold - number of events in timeframe to trigger alert (Default=100)
QUERY_TYPE: Filter by DNS query type (Default=*)
RESPONSE_TYPE: Filter by DNS response (Default=*)
Resolver - Cloud communication failure
This Alert is sent when the backend does not receive any message from the local resolver agent for more than 20 minutes.
Resolver - Insufficient hardware resources
This Alert is sent when the local resolver agent detects that the hardware utilization has increased over the defined treshold. The parameters are expressed as percentages of utilized compared to total resources. As an example, if you want to be alerted when the host uses 80 % of total disk space, set the THRESHOLD_HDD to 80.
THRESHOLD_CPU: Utilization of CPU (Default=80)
THRESHOLD_MEMORY: Utilization of RAM (Default=90)
THRESHOLD_HDD: Utilization of HDD (Default=80)
Resolver - Resolution service failure
The resolver periodically performs checks to test resolution of well-known domains. Google.com, facebook.com, microsoft.com and apple.com are checked every minute. The default setting of the parameters is very strict, so even if resolution of one of the four domains during a 10 minute time interval fails, the alert is sent. Parameters:
TRESHOLD: number of events to occur during the timeframe to trigger the alert (Default=1)
MINUTES: timeframe in minutes (Default=10)
Threats - count during intervals
This alert is sent if the percentage of threat records is higher than the set time period. Parameters:
MINUTES: time window in minutes (default=15)
TRESHOLD: number of events in the time window for triggering the alert, this is a percentage change (default=100).
LOG_TYPE: (default=*): filters by event type (audit/block)
Threats - event detection
This alert is sent in the case of a new entry in the threats page according to the specified threat type and action performed. Parameters:
LOG_TYPE: (Default=*): filters by action type (audit/block)
THREAT_TYPE: (Default=*): filters by type of threat detected
Threats - newly blocked domain
This alert is sent if the resolver detects a newly blocked threat within the specified time frame. Parameters:
DAYS: Number of days on which newly blocked domains will be searched (default=30)
DOMAIN_WILDCARD: Include only the following comma-separated domains in the alert(Default=*)